
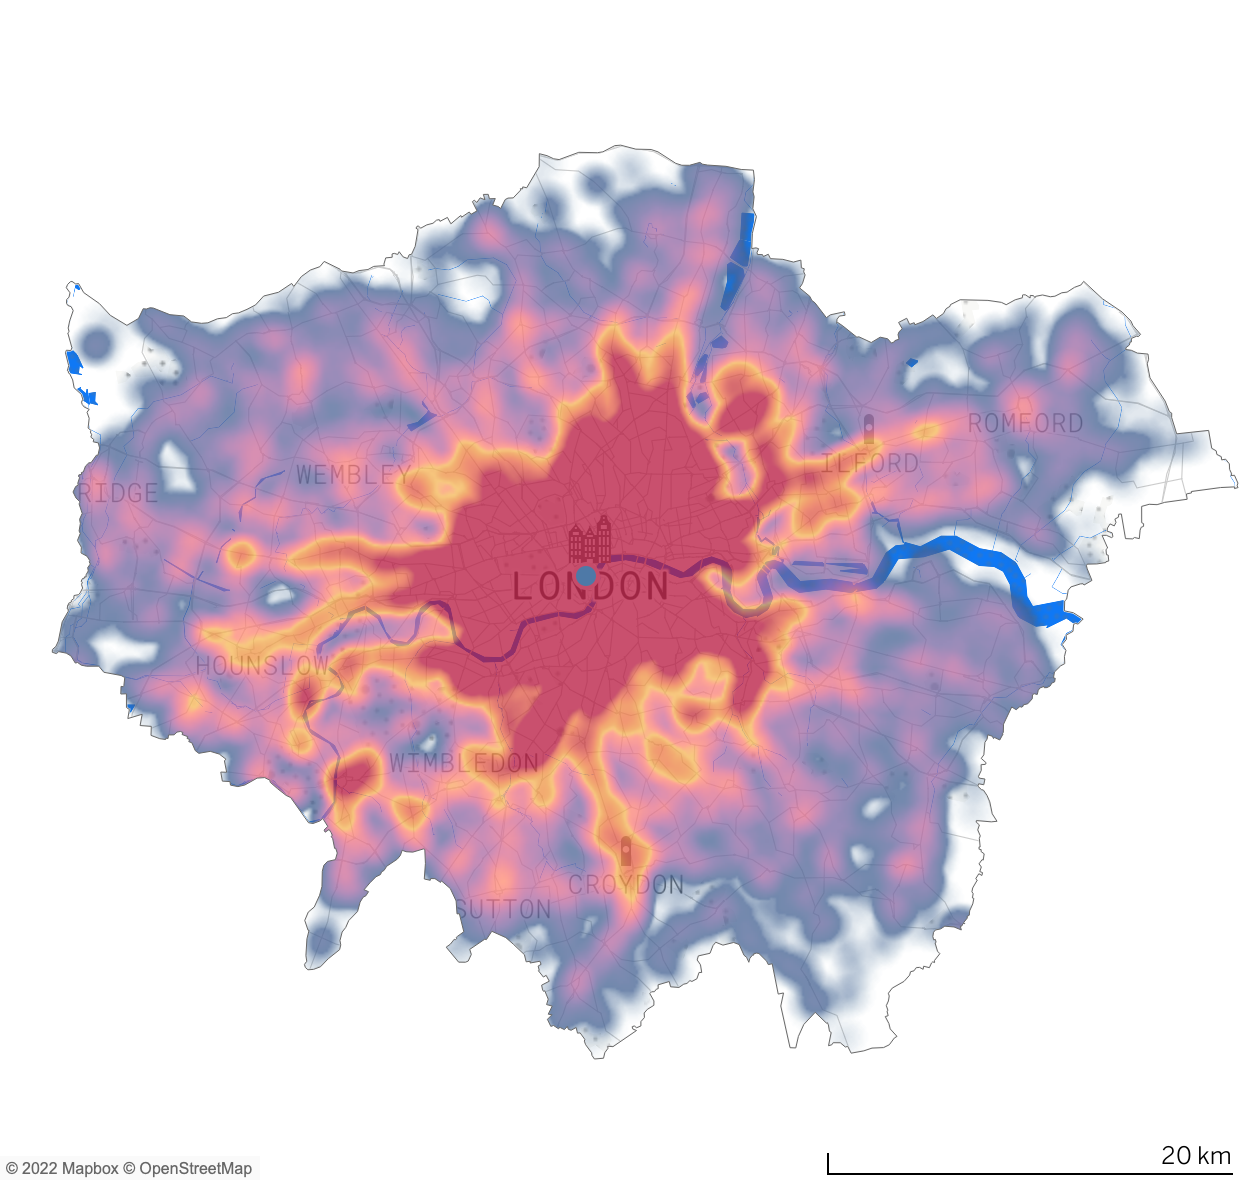
In Tableau desktop you can visualise the geographical distribution of data by using maps. The background of those maps can be changed, using the default options or by using a custom Mapbox. It's also possible to use Shapefiles, so you would only see the contours of the desired city or country by creating a map outline. Unfortunately it is not possible to use a custom map background and to use the shape of the shapefile at the same time. This is not possible, unless you use a workaround. Lucky for me, I could ask Map Enthousiast Joris to help me with this issue. In the images below you can see the end result:
Inspiration: Makeover Monday 2021w31 data: Cyclestreets
Creating and adding an inverse Shapefile
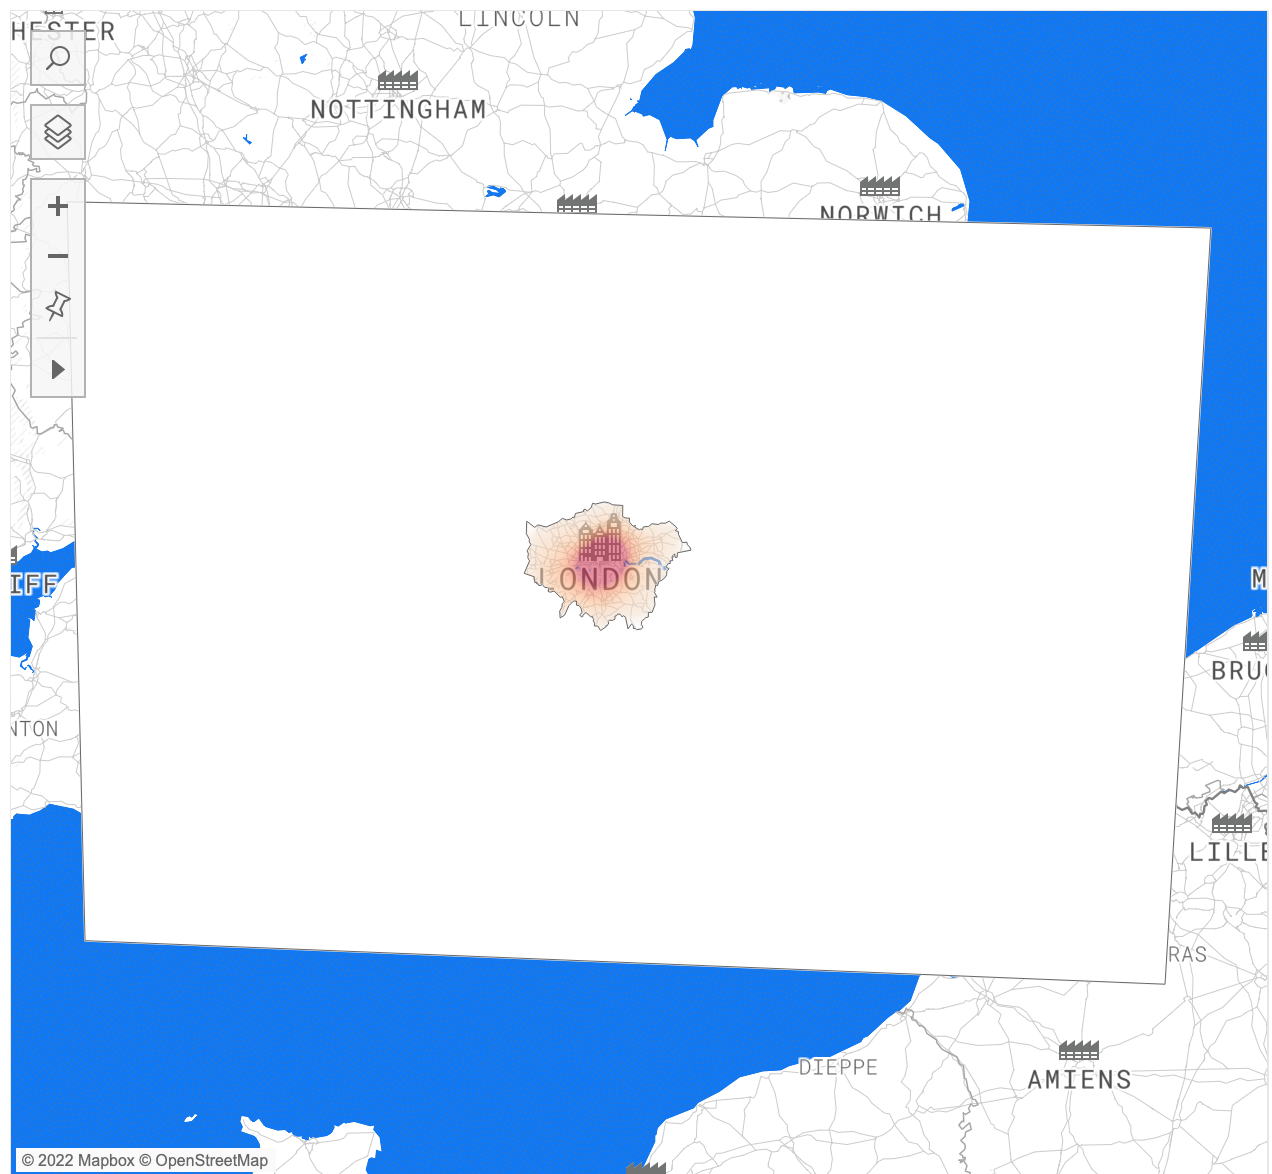
By adding the inverse shape of a Shapefile, it became possible to make this shape a solid color. This creates the illusion of a shapefile and at the same time it was also possible to use the Mapbox map. The only downside is, that when you zoom out, you see that little trick. So a solution would be to disable all map options.
So what do you need? A nice colleague that helps you, or to create the inverted Shapefile yourself with QGIS. The custom Mapbox map you can create with Mapbox Studio, in this example I took the 'Minimo' map, and changed all water to The Information Lab blue.
How to build your map outline in Tableau?
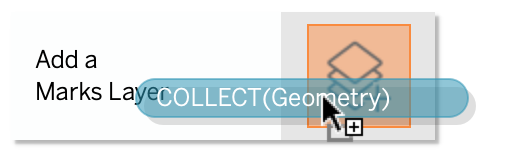
Create a map with your Mapbox token as you would normally do. Open your inverted Shapefile as a separate datasource, there is no need to combine this with your current data since Tableau Version 2021.4. From your inverted Shapefile, drag geometry in to the map until you see "Add a Marks Layer".
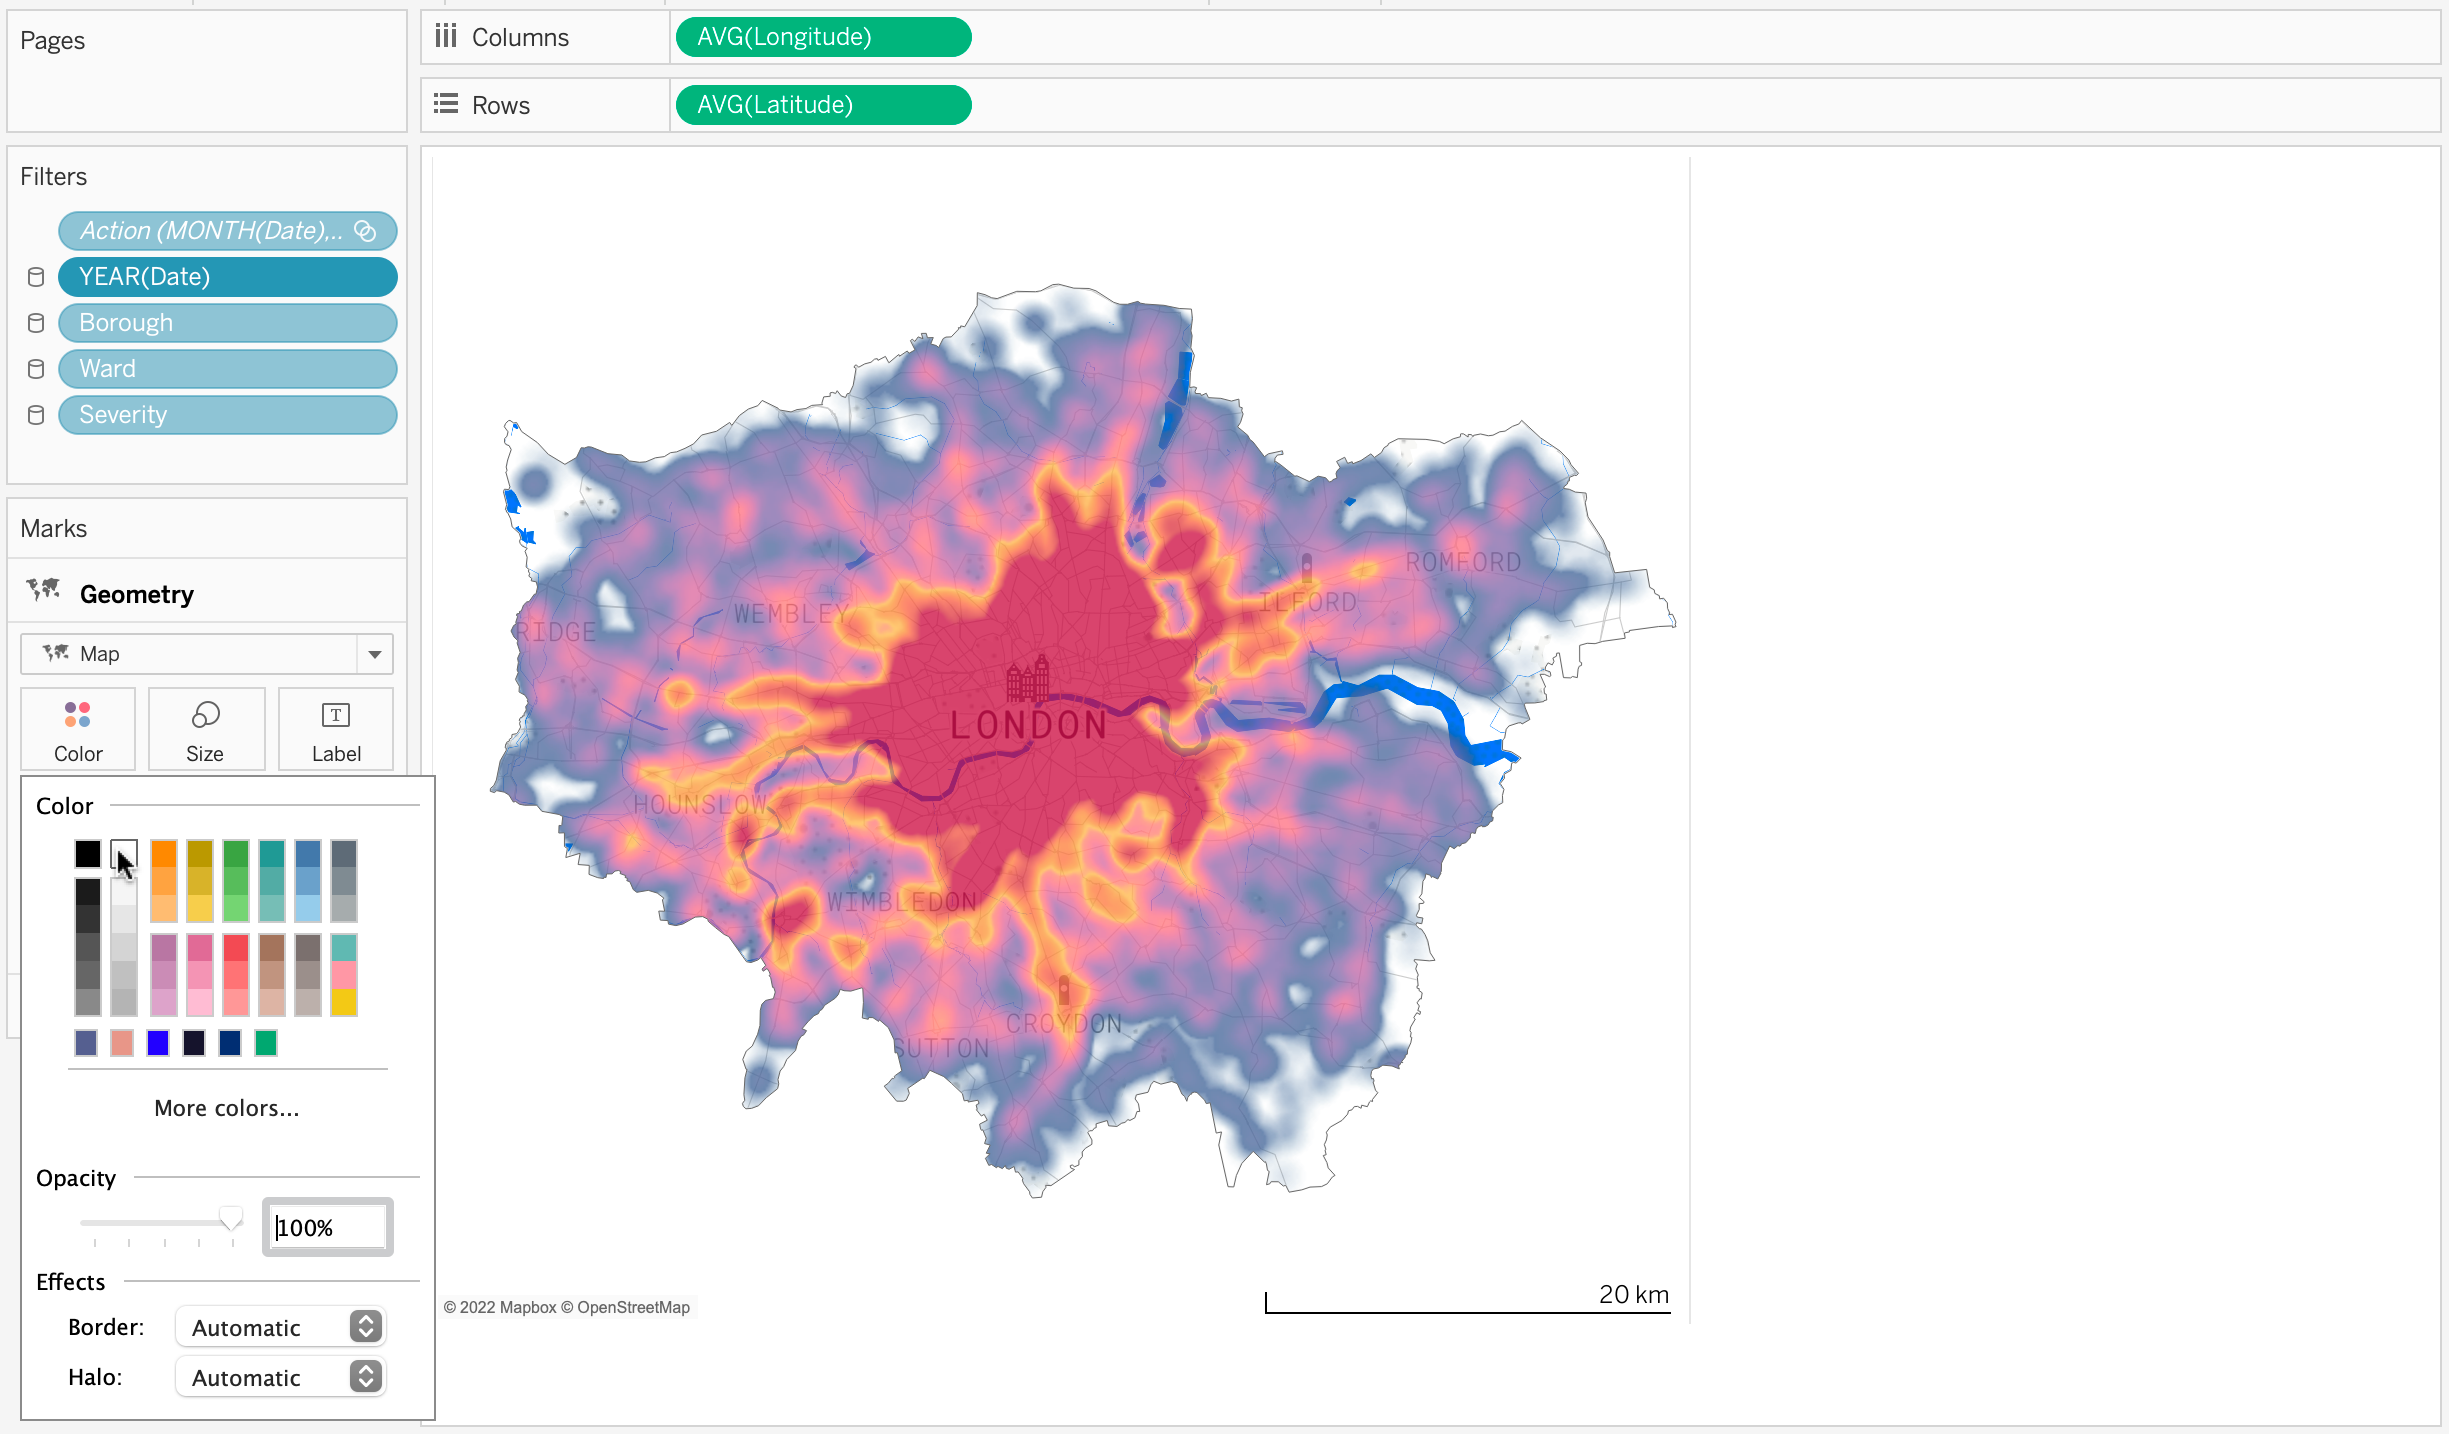
Most likely you will see that nothing happens, only a big dot. Change the marks type to map, you will see that your dot transforms in the shape of your map. Change the color, if your dashboard background is white, change it to white. If you use dark mode background, change it to this darker color. Make sure the opacity is set to 100% and your custom Mapbox map with Shapefile is done.
Interact with, and download the dashboard on my Tableau Public.
Thank you for reading my blog, and if you have any questions don't hesitate to ask them. Take a look at my Instagram and Tableau Public.