
When creating a dashboard, you don't always want to show all of your information. In most cases, you select a subset of your data and will show that to focus on a certain area. But what if you want to know how big that part is from the total of your data or category? You filtered your data, so you want to calculate something that is not shown in the view. How to calculate a percent of total that is not in the view in Tableau Desktop? When using a Table Calculation in Tableau, you will calculate the percent of total of what you see in the view. So when you use filters, they will also apply to your total amount, and therefor impact the percent of total that you see. Sometimes you only want to show specific members of a dimension field, but calculate your Percent of Total on all of your data and members in that field and not only your filtered data. How can you do this?
Percent of total and filters
What if you would like to only show the Sales of the State New York and the segment Corporate, compared to all of the Sales values in your data set? When you filter the view, everything in the view automatically gets filtered. In the image below you see the sales value for all States and all segments:
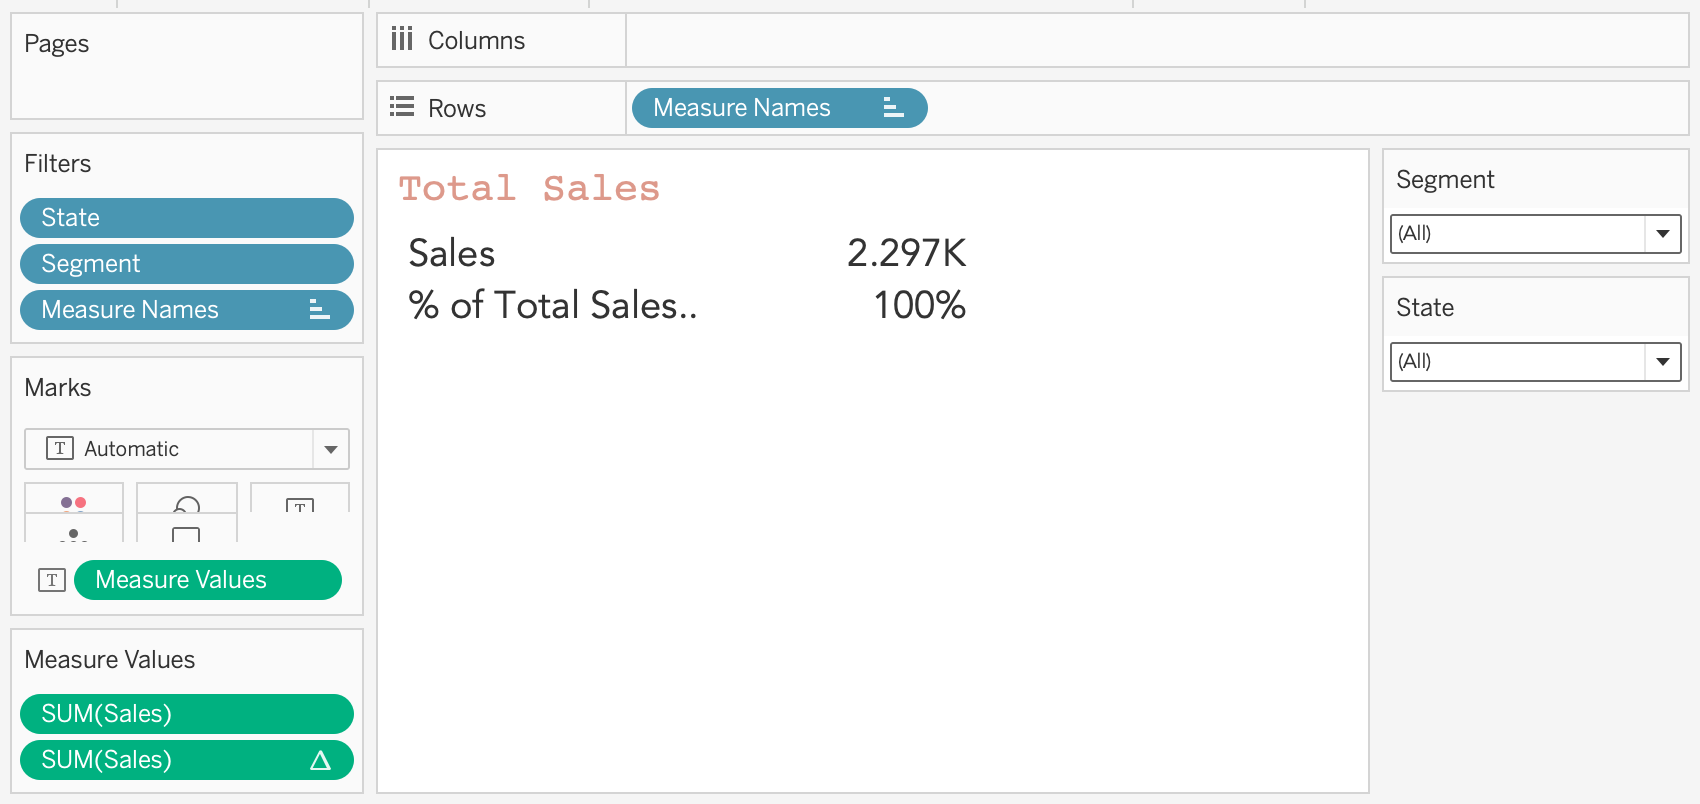
When you select New York and Corporate, you will only see the selected Segment and State and the data is filtered. When you apply a Table Calculation Percent of Total you will see that the number you see in the view for Sales is your Percent of Total: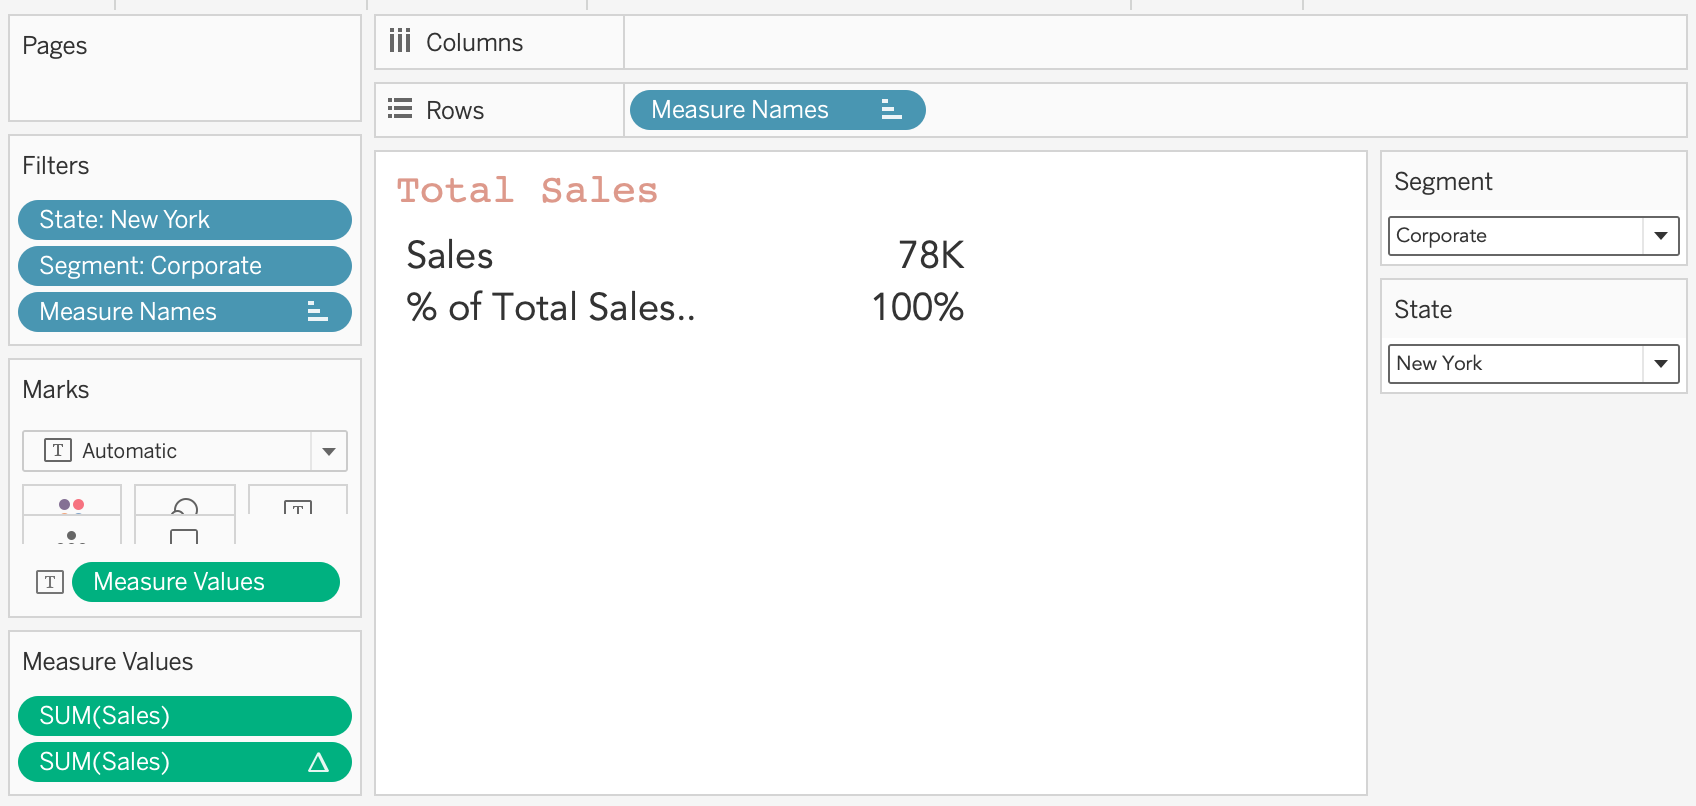
The Procent of Total calculation is a Quick Table Calculation and will calculate the total from what is shown in the view (SUM([Sales]) / TOTAL(SUM([Sales])). Even though all of your sales in your data source is 2297K combined, the filtered view shows 78K so this is your total and current 100%.
Order of Operations in Tableau and Level of Detail
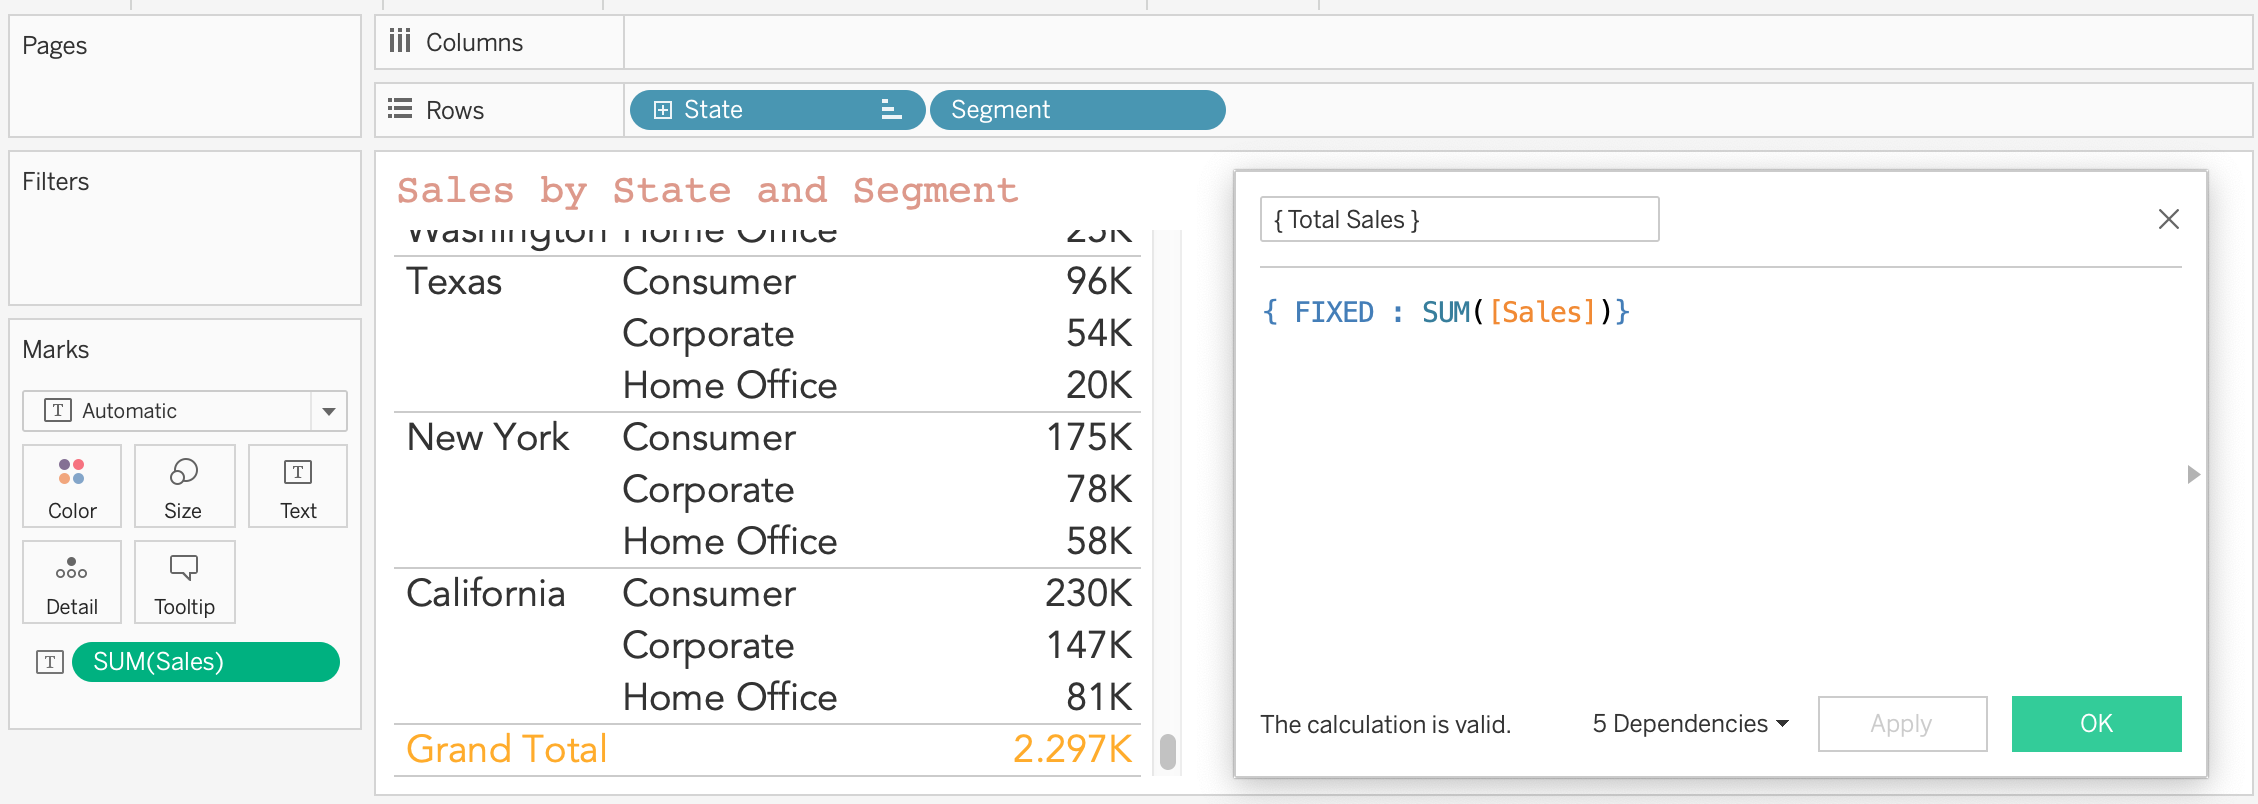
The fields used as filter are Segment and State, both fields are dimension fields. Tableau has a specific Order or Operations, first the dimension filters will be applied, and after that the Table Calculations. What we could use is a Fixed LOD, a Level of Detail expression. This Fixed LOD expression will be computed before the dimension filter. Therefore the Segment and State filter will not have impact on the Fixed LOD expression.
First we create a field that shows our whole 2297K total sales, independent of the dimension filters in the view. By using a Fixed LOD expression, this field will return 2297K on every row, this is the total SUM of sales. An example of this calculation can be found in the image below:
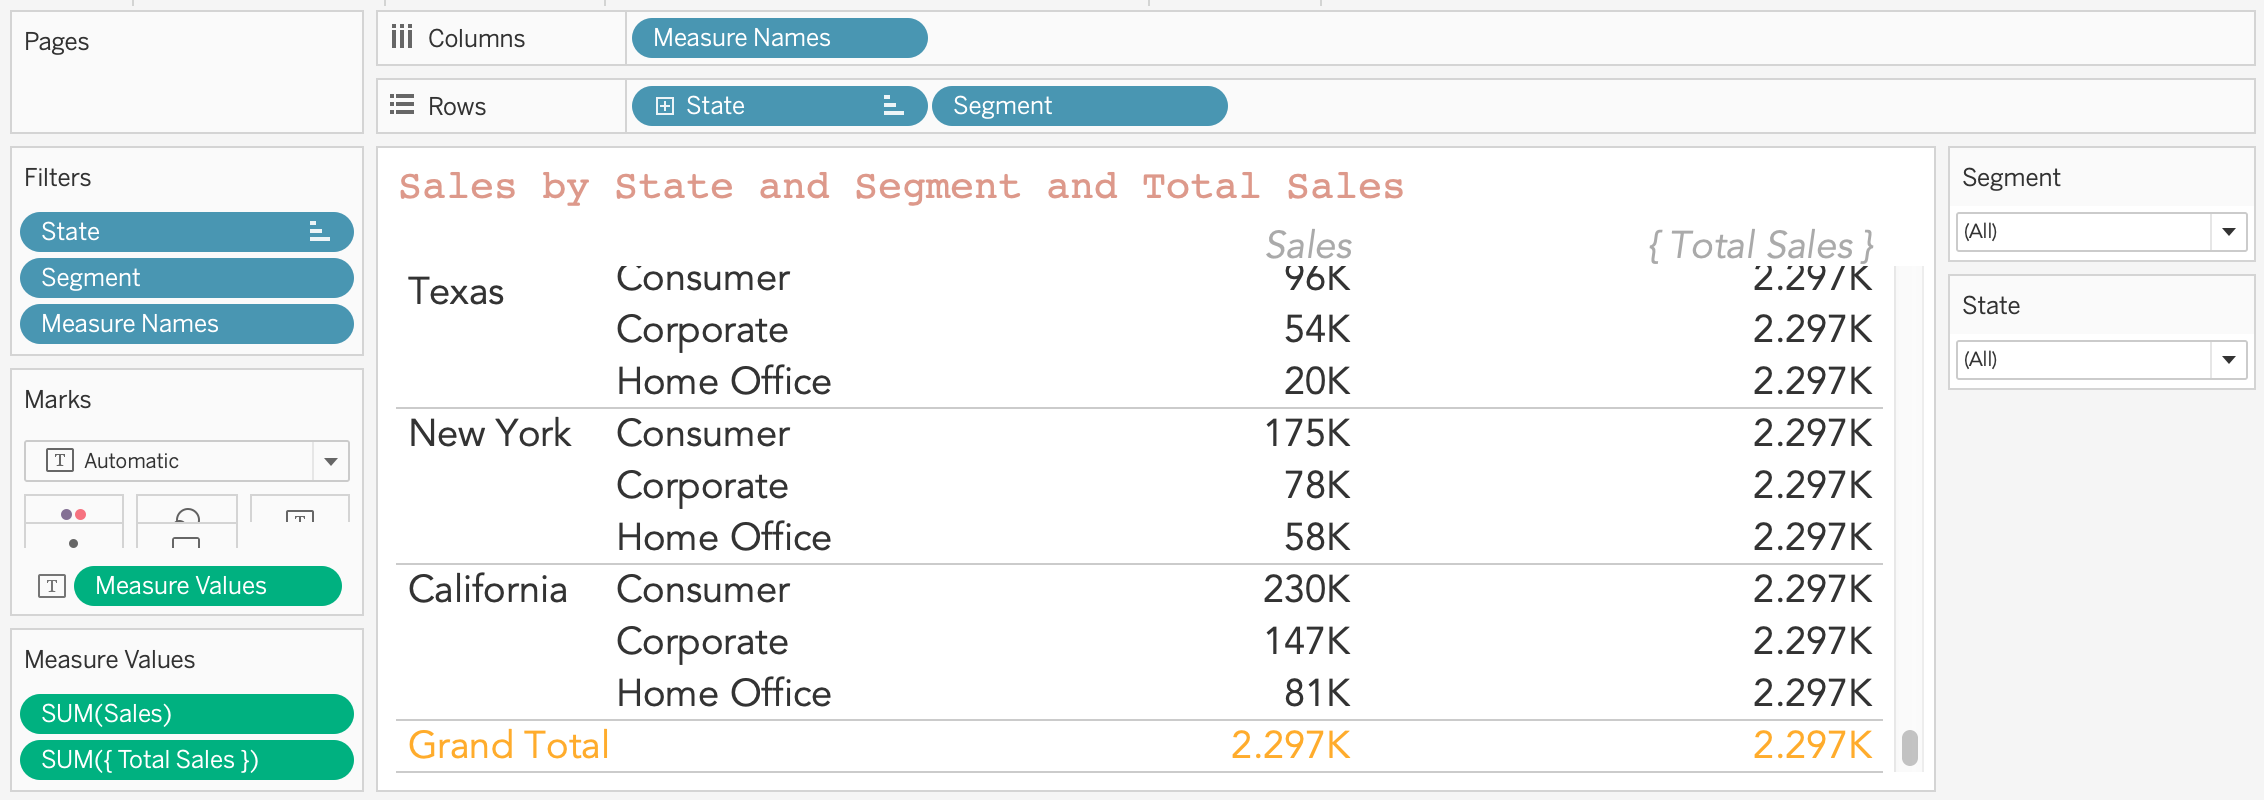
When using this created {Total Sales} field in the view, for every row there will be the amount of 2297K:
Percent of Total Quick Table Calculation
When applying a quick table calculation, the percentage looks right for New York and Corporate Sales (SUM([Sales]) / TOTAL(SUM([Sales]) would be 78K / 2297K = 3,4%).
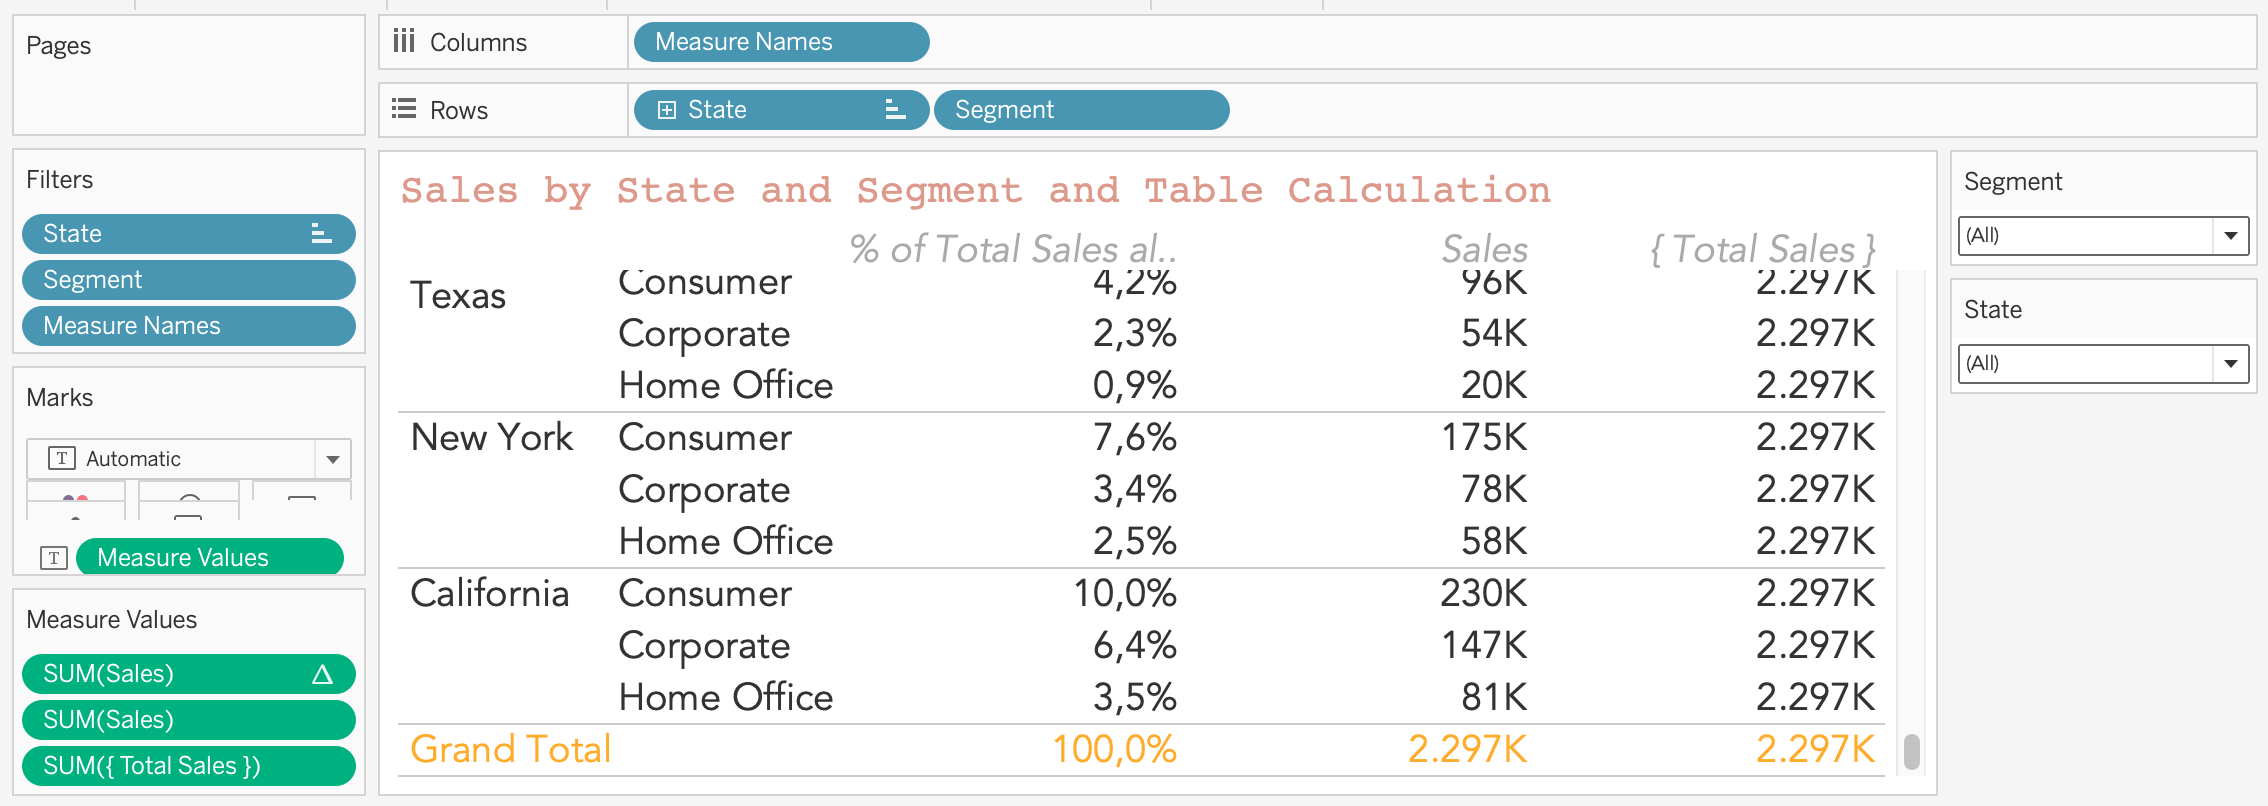
The filtered Percent of Total does not look right?
When filtering the data by New York, we can see that the {Total Sales} field still displays 2279K, but the Percent of Total Quick Table calculation does not seem right, it displays 25,1% instead of 3,4%: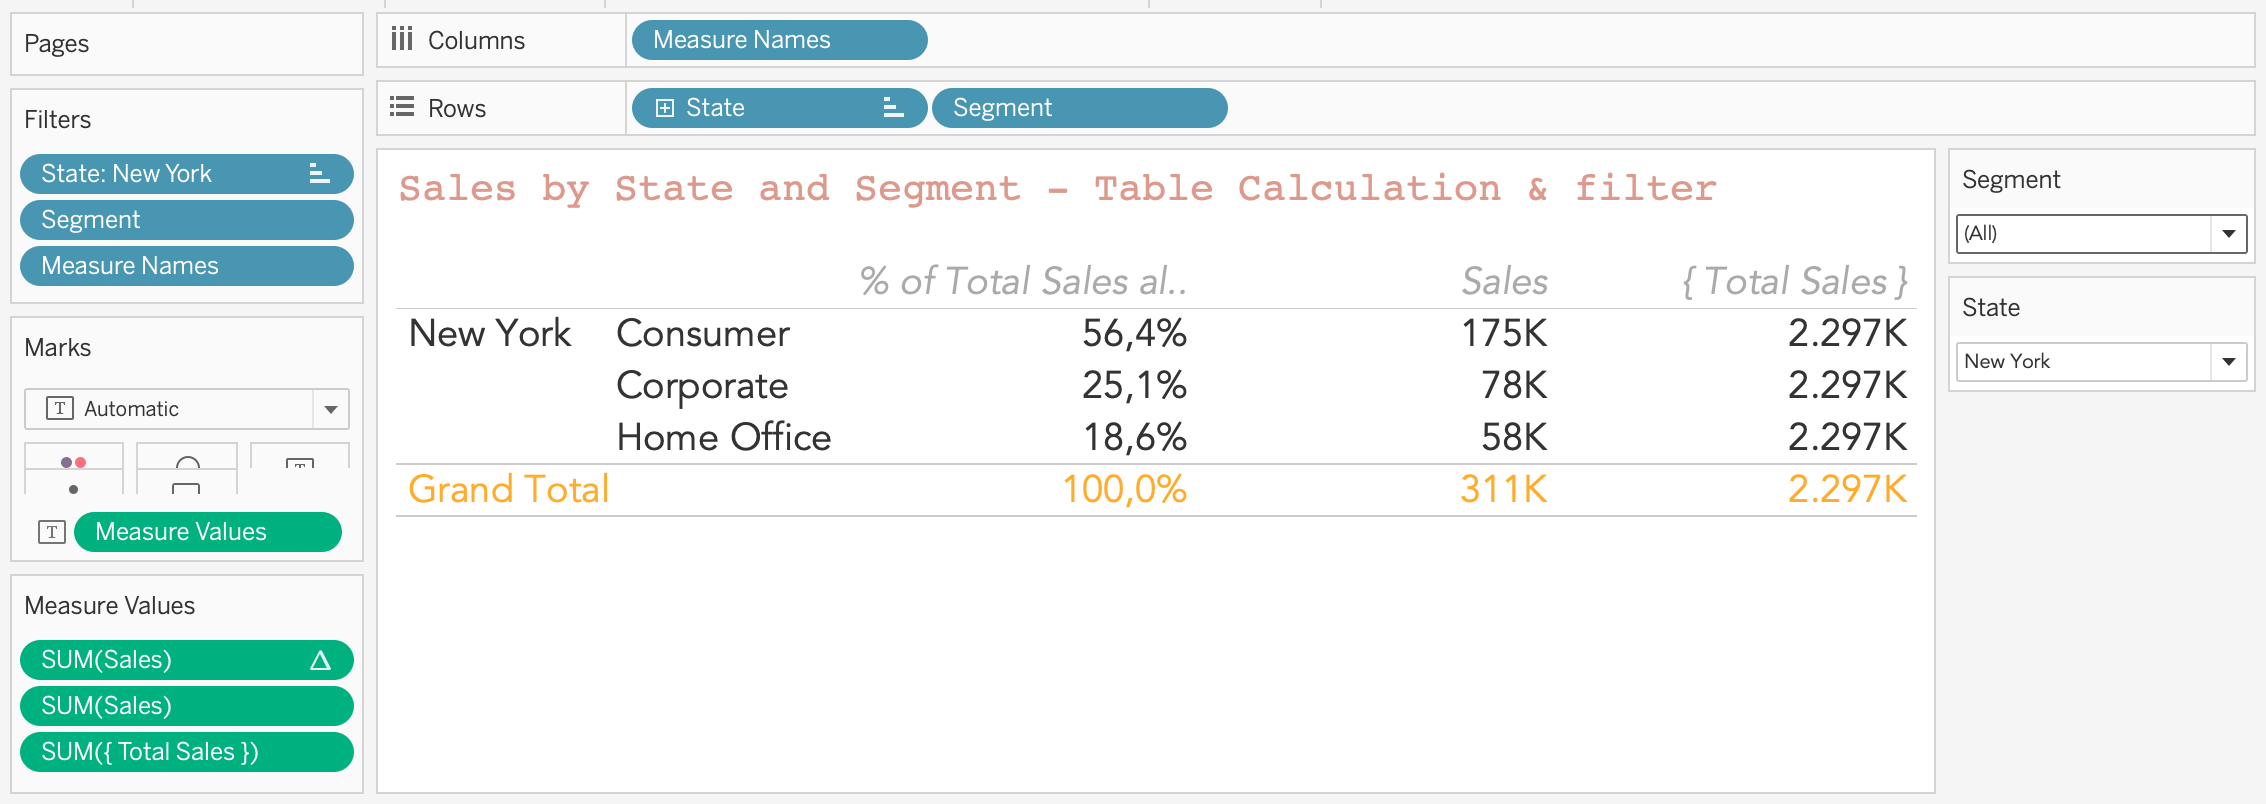
Write a calculation for the Percent of Total
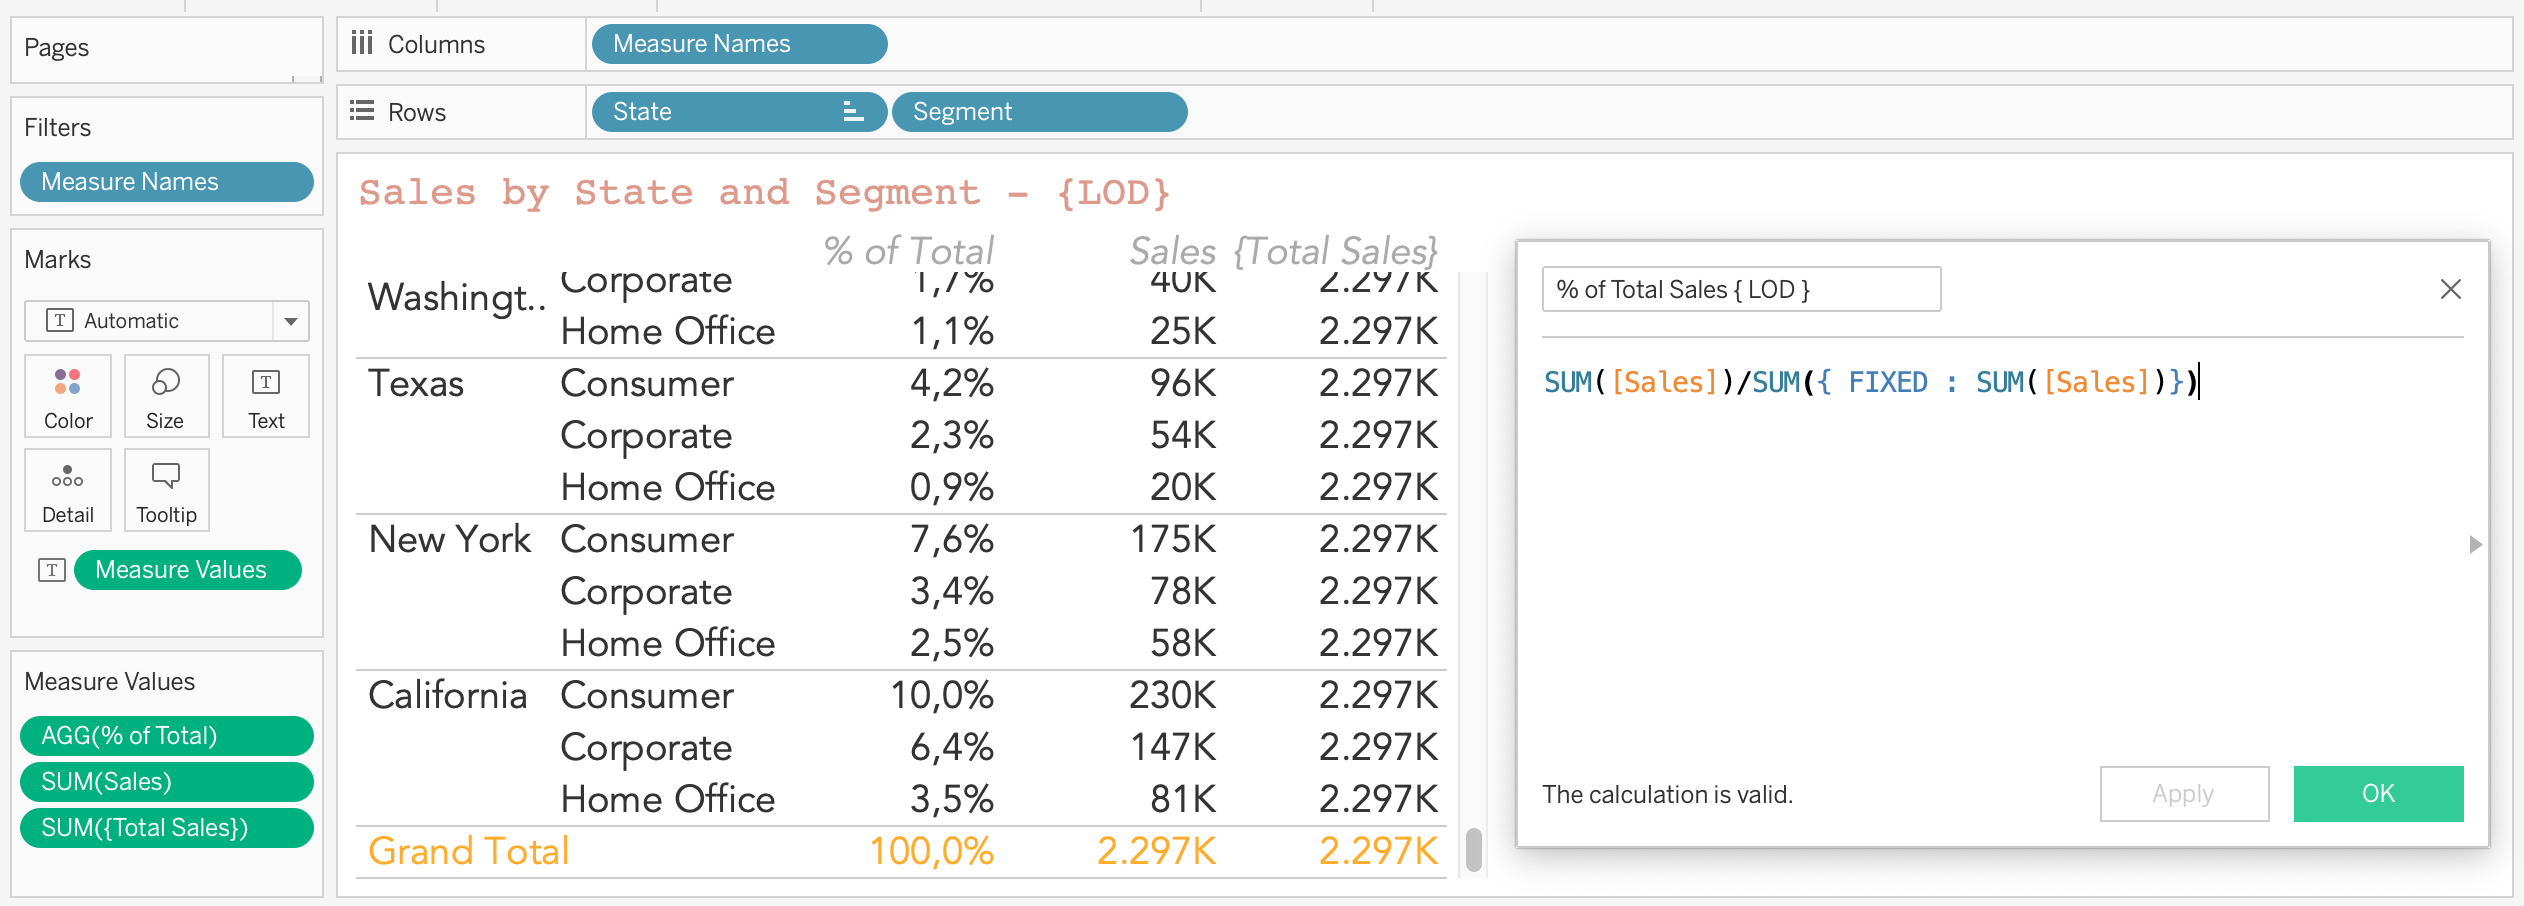
The quick table calculation still looks at all the total sales in the view from the SUM(Sales) field (SUM([Sales]) / TOTAL(SUM([Sales]) becomes 78K / 311K = 25,1%). The next step is to combine the SUM(Sales) field and the created {Total Sales} field and create a new field for the procent of total. An example of the calculation can be find in the image below:

The Percent of Total for Corporate sales New York is 3,4%, even with the State filter in the view. The first part of the calculation is aggregated, we use the SUM of Sales. Since the first part is aggregated, the second part also needs to be an aggregation.
Break it down in smaller steps
When I run in to something I can not figure out right away, I like to break down the issue in smaller steps. When all the separate steps make sense, it's time to combine them. We could have written the formula as in the image below right away, but if there is an error we spend a lot of time looking where the error could be. By taking smaller steps, it gives you overview and clarity.
You can also see a summary in this step by step tutorial:
If you have any questions about this topic don't hesitate to ask me on Instagram or Twitter. The workbook used can be found on my Tableau Public profile.
- Log in to post comments